CUTLER'S 2024 Q1 MARKET UPDATE
April 17, 2024
Market Commentary and Outlook- First Quarter 2024
As our calendars turned from -23 to -24, the stock market hardly seemed to notice. 2023 was a year that defied the odds, as stocks rallied and the economy marched forward. Despite indicators that the US was headed for a recession, such as an inverted yield curve, GDP instead grew at 3.2% in the final quarter of the year. The first quarter appears to have followed suit, with current GDP estimates (by the Atlanta Fed) at around 2.9%. How has the US continued to grow? On the backs of consumers, who have been flush with cash from the stimulus and wage growth in a tight labor market.
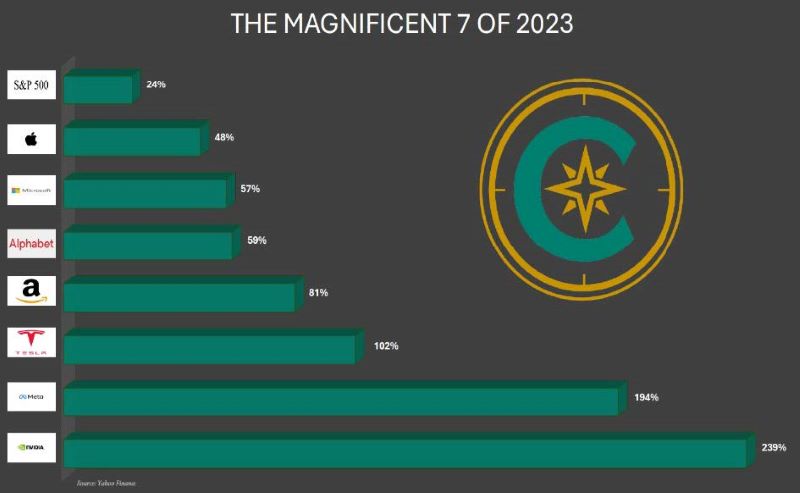
One shift in the markets from last year, however, is that the first quarter rally had broader participation. The Magnificent 7 stocks had a year unlike few others last year, and these 7 stocks carried the markets higher. Collectively, they increased 75% last year! (See the chart nearby.) However, the stock market rally in 2024 has been broader based. Energy stocks have boosted Value benchmarks, with this sector riding oil’s coattails to a 13.5% gain in Q1. Financials, also a large component of Value stock measurements, rose over 12% in the quarter on the hopes of muted inflation.
More recently, however, these hopes of lower inflation have decreased. The Fed Futures market started the year with a 100% probability of a rate cut by June. The Q4-24 rally was largely dependent on this lower rate forecast. As of April 15, however, Fed Funds Futures for June had dropped to just 16% probability. What changed? Persistent inflation data and a Fed that does not want a re-emergence of 2022’s nightmare inflation regime. The Core Consumer Price Index of inflation was reported at 3.8% in March, while February’s number was 3.4%. This is not a good trend, and with energy prices also marching higher, Headline inflation (which includes both food and energy) could also tick higher.
What is notable about this change in inflation expectations has been the resilience of stocks in the face of some mild inflation surprises. The underlying economic strength is a large explanation as to why. We are closely watching key metrics of consumer strength, such as credit card delinquencies, which will provide some indications of the economic outlook from here.
As we move ahead, what other key questions are investors focused on? We’ve addressed a few here below. Our answers have a theme; remaining invested is the best investment approach for long-term returns. We continue to advocate that our clients not try to “time the market,” but instead remain focused on their goals and portfolio risk profile.
With valuations stretched, can stocks go higher from here?
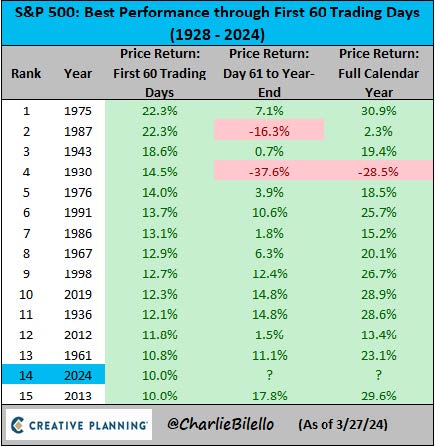
Strong returns don’t mean that stocks need to sell off. Consider the chart nearby, which shows the full year returns following years that began like 2024. Other than 1930 and 1987, the results were favorable. Knowing a potentially volatile election year is ahead of us, we would still advise clients to remain invested, but to also be cognizant of value. By almost every measure, stocks are expensive relative to historical comparisons. (The average forward P/E for S&P 500 stocks is 20.96x versus the 30-year average of 16.62x.) But not all stocks. We remain biased toward Value stocks such as dividend paying companies that we believe represent a great value in an environment of high valuations. Dividends may comprise a greater percentage of total returns should stock rise at a more moderate pace going forward.
What about global geopolitics?
Geopolitics can have a large temporary impact on the markets. Oil prices in particular are subect to large swings from conflicts which are often based in oil-producing regions. 2022 saw a huge rally in oil prices after the Russian invasion of Ukraine. We have also seen a rally this year in concert with war in the Middle East. But these political oil price shocks tend to be short-lived, and increases in price are typically followed by increases in supply. Oil prices (West Texas Intermediate) have rallied from $71 to $85 this year, a rally that has also been felt in gas price increases. However, this cycle is typically self-correcting and patient investors can wait out the volatility. More concerning are long-term structural changes in the global economy. De-globalisation, often in the form of onshoring, has the potential to put a floor under inflation. Many companies are looking to have a more secure supply chain, which means that the low-cost producing region (aka China for the past three decades) may no longer be the default choice. This may result in a rate envirnoment higher for the next decade than the past, and portfolio positioning should reflect this possibility.
Can consumers continue to support the US economy?
We mentioned above that GDP growth has been above trend due to a heavy lift lift from consumers. Consumption represents 67% of US GDP, so the spending habits of the US population cannot be ignored. Recent retails sales for March have been strong and exceeded forecasts, but certain other indicators suggest that US consumer spending might slow down. With credit card rates at an all-time high of 21.3%, can consumers continue to “charge it and forget it.” Credit card defaults are now at a 12-year high; a possible canary in the coalmine. Auto loan defaults also sit a decade highs. To sustain the economic growth, wages will need to continue to rise to offset these trends, and thus far they have. Wages were up 4.5% in February versus the long-term trend of 3.9% growth (source: JP Morgan).
Asset Class Positioning
While much of the above commentary has been regarding stocks, the returns of the bond market were perhaps most surprising in Q1. The Bloomberg Aggregate bond index declined 0.78%, and these losses have accelerated in April with the higher inflation reports. At mid-April, the 10-year Treasury sits at 4.66%. The yield-curve remains slightly inverted, with rates of less than one-year all over 5%. This has benefitted savers with assets in money market funds, but we would advocate investors in these funds reposition to longer-bonds or stocks at this time, depending on your risk tolerance. The drumbeat of higher inflation data has pushed rates upward, but any softening of this data can quickly send those rates downward once again.
The S&P 500 Index finished the first quarter up 10.56%. Once again, large growth stocks led the way up 11.41%. But value also had an impressive 8.99% return for the quarter. Small-cap stocks have continued to show their interest-rate sensitivity. After a big rally in Q4, this index was up 2.47% in Q1, but has quickly gone negative in April. Smaller companies have a much greater reliance on debt financing, and this index has traded at the whims of the latest interest rate trends in recent years. International Developed stocks, after a strong 18% showing in 2023, have followed suit with a 5.9% return in Q1. We continue to like the relative valuations available in the international markets.
Alternative asset classes, such as Bitcoin have also been on investor’s radar of late. In the first quarter of this year, the SEC approved the first “spot futures” Bitcoin ETF. The result of this has been a lowering of the cost structure and increased accessibility for Bitcoin investors. Similar to Gold, which has also rallied on a “global fear” trade, we do not advocate owning cryptocurrencies in our models. The reason? We believe that investments should have intrinsic value in the form of cash flows or earnings growth. Each of these asset classes represent value only so much as they are worth what a buyer is willing to pay. This musical-chairs type of investment can work great; until it doesn’t.
Large Cap Stocks are represented by the Standard & Poors (S&P) 500 Index, a world-renowned index including 500 leading companies in leading industries in the U.S. economy. The S&P 500 focuses on the large cap segment of the market, with approximately 75% coverage of U.S. equities, and is an ideal proxy for the total market.
Large Value Stocks are represented by the Russell 1000 value index which measures the performance of the large cap value segment of the U.S. equity universe. It includes 1000 companies with lower price-to-book values and lower expected growth rates.
Large Growth Stocks are represented by the Russell 1000 growth index which measures the performance of the large cap growth segment of the U.S. equity universe. It includes 1000 companies with higher price-to-book values and higher expected growth rates.
Mid Cap Stocks are represented by the Standard & Poors (S&P) MidCap 400 Index, a widely used index for mid-sized U.S. companies. Smaller and medium sized companies are more volatile than larger, more established companies.
Small Cap Stocks are represented by the Ibbotson and Associates Small Stock index through 2019, which represents the aggregate of the NYSE, American Stock Exchange, and the NASDAQ listed companies with market capitalization of 708 million or less. In 2020 and forward, Small Cap Stocks are represented by the S&P SmallCap 600 Index which covers roughly the small-cap range of American stocks, using a capitalization-weighted index Smaller and medium sized companies are more volatile that larger, more established companies.
International Stocks are represented by the MSCI EAFE, which represents a selection of stocks from 21 developed markets. The MSCI EAFE Index is recognized as the pre-eminent benchmark in the United States to measure international equity performance.
Emerging Markets Stocks are represented by the MSCI EM index, which is an emerging markets index, consisting of 23 emerging economies. Emerging markets are considered relatively risky because they carry additional political and economic risk. Their performance is generally uncorrelated to developed markets, and thus provides diversification in a portfolio.
Real Estate is represented by the FTSE NAREIT US Real Estate Index, which is designed to provide the most comprehensive assessment of the overall industry performance and includes all tax qualified real estate investment trusts (REITs) that are listed on the New York Stock Exchange, the American Stock Exchange, and the NASDAQ.
Aggregate Bonds are represented by the Barclays Capital Aggregate Bond Index, which covers USD denominated, investment grade, fixed income securities. The index consists of bonds from various sectors of the bond market, including treasuries, government agencies, corporate, mortgage backed, and asset backed securities.
Short Term Bonds are represented by the Barclays Capital Government/Credit 1-5 Year Index, which is an index of all investment grade bonds with maturities of more than one year and less than 5 years.
Past performance does not guarantee future results. The performance data represents past performance and current returns may be lower or higher. Performance is historical asset class returns and does not represent the performance of any Cutler Investment Counsel strategy. Investments in international securities involve additional risks due to economic and political conditions, and differences in financial reporting standards. Smaller and medium sized company stocks are more volatile and less liquid than larger, more established company securities. An investment cannot be made directly into an index.
Source: Morningstar All opinions and data included in this commentary are as of April 15, 2024 and are subject to change. The opinions and views expressed herein are of Cutler Investment Counsel, LLC and are not intended to be a forecast of future events, a guarantee of future results or investment advice. This report is provided for informational purposes only and should not be considered a recommendation or solicitation to purchase securities. This information should not be used as the sole basis to make any investment decision. The statistics have been obtained from sources believed to be reliable, but the accuracy and completeness of this information cannot be guaranteed.
CATEGORIES
ARTICLES BY YEAR/DATE
Disclaimer
These blogs are provided for informational purposes only and represent Cutler Investment Group’s (“Cutler”) views as of the date of posting. Such views are subject to change at any point without notice. The information in the blogs should not be considered investment advice or a recommendation to buy or sell any types of securities. Some of the information provided has been obtained from third party sources believed to be reliable but such information is not guaranteed. Cutler has not taken into account the investment objectives, financial situation or particular needs of any individual investor. There is a risk of loss from an investment in securities, including the risk of loss of principal. Different types of investments involve varying degrees of risk, and there can be no assurance that any specific investment will be profitable or suitable for a particular investor's financial situation or risk tolerance. Any forward looking statements or forecasts are based on assumptions and actual results are expected to vary. No reliance should be placed on, and no guarantee should be assumed from, any such statements or forecasts when making any investment decision.